Case studyE-commerce · Shopify
2.88 million impressions, and a counter that never stops.
A Shopify retailer whose organic visibility doubled in a quarter, and a storefront doing $623,689 a month behind it. Every figure on this page is a screenshot, not a claim.
- E-commerce
- Shopify
- Organic search
+118%
Search growth
clicks and impressions, 3 months2.88M
Impressions
Jun 28 – Sep 26, 202631.6K
Clicks
1.1% average CTR$623,689
Sales in August
2,822 orders fulfilled
AI Overview
SummaryOver three months, this Shopify retailer's organic search visibility grew 118%, reaching 2.88 million impressions and 31,600 clicks at an average position of 7.6.
The business now turns that visibility into $623,689 in monthly sales across 2,822 fulfilled orders, at an average order value of $224.96.
Most of that revenue — $528.8K of $623.6K — is taken in person at the counter rather than online, which is what organic search does for a retailer with a storefront: it creates the discovery that walks through the door.
Sources
- Google Search ConsoleJun 28 – Sep 26, 2026
- Shopify AnalyticsAug 1 – 31, 2026
01The chain
How 2.88 million impressions become $623,689.
Six steps, each the reason the next is possible. Numbers are easy to list and hard to justify, so here is the justification.
- 01
2.88MImpressions
How often the store appeared in Google over three months. This is the ceiling on everything below it — nothing can be clicked that was never shown.
- 02
31.6KClicks
1.1% of those impressions became a visit. Appearing is not the same as being chosen, and the gap between the two is the title, the snippet and the position.
- 03
7.6Average position
Page one, across the whole query set rather than a handful of vanity terms. Position is what moves impressions into clicks at any kind of scale.
- 04
53,846Sessions
Visits to the store in August from every source. Organic search is one of them, feeding the top of this number rather than being all of it.
- 05
2,822Orders fulfilled
At an average order value of $224.96. This is the step most visibility work never reaches, because traffic that does not convert is just a bill.
- 06
$623,689Total sales, August
What the month actually came to. $528.8K of it over the counter, $49.5K through the online store, the rest across draft orders and Shop.
02The screenshots
Taken from the client’s own dashboards.
Nothing here is recreated, redrawn or rounded in my favour.
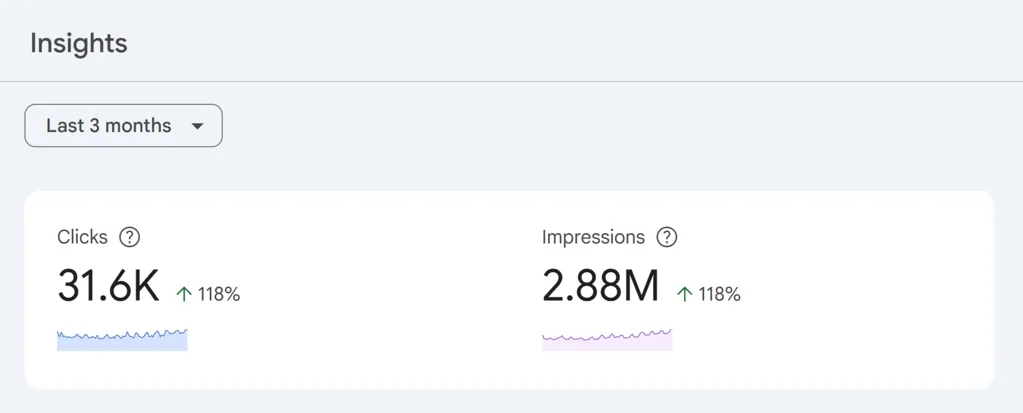
Clicks 31.6K and impressions 2.88M, each carrying the same +118%. Growth on both halves at once means more queries matched and more of those matches earned the click, not one at the expense of the other.
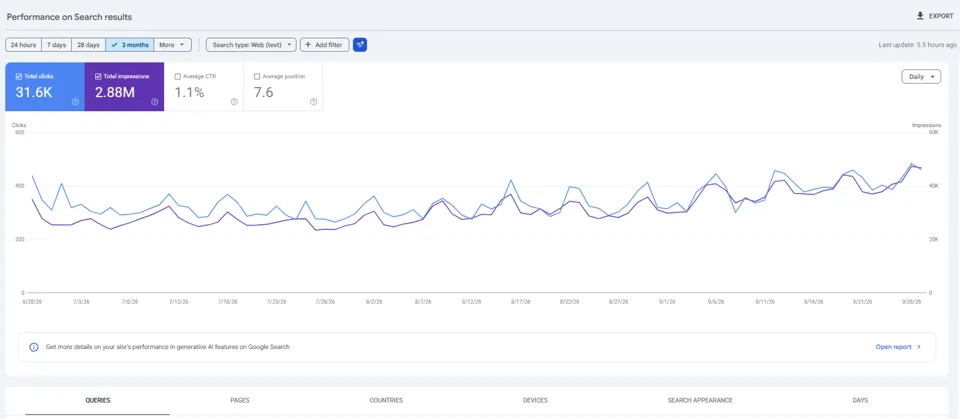
The same quarter drawn out day by day. The line climbs through the whole period instead of spiking once, which is the difference between a campaign and a position, and the average lands at 7.6, on page one.
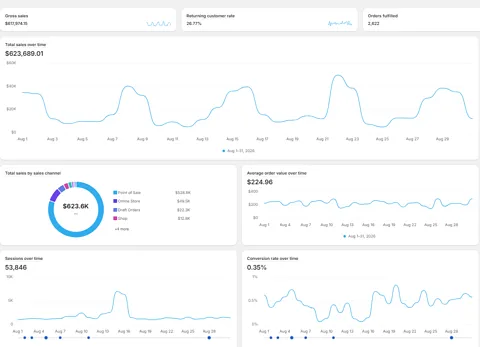
One month of trading: $623,689.01 in total sales, 2,822 orders at $224.96 each, 53,846 sessions. The donut is the important part: Point of Sale $528.8K, Online Store $49.5K, which is why the claim above is about discovery rather than checkout.
03What it shows
What this actually proves.
It held for a quarter
Three months of daily data, climbing throughout. A single good week is noise; a quarter-long trend is a position that has to be earned and then kept.
Both halves moved together
Impressions and clicks both up 118%. Visibility that grows without clicks means the listings are not persuading anyone. Here they are doing both.
It reached the till
2,822 fulfilled orders at $224.96. Most visibility work stops at traffic because traffic is where the reporting is comfortable. This one carries through to revenue.
Want this kind of paper trail?
I report the same way I work: the number, where it came from, and what it does and does not prove. Start with a free audit of where you stand now.
I reply within 24 hours.